Combining Data Set
In our exploratory data analysis, we have chosen to use about 8 different data sets. This includes data on population, water quality, aid disbursement, air quality by country, slum population, services, and land consumption. Below are descriptions of the data sets that we are working with:
- Urban Population This data set includes data of a country’s urban population for different years.
- Water Quality This data set records data of not only a country’s water quality, but also whether or not the country’s urban population has access to different types of basic necessities including water, sanitation, telephone, electricity, and more. Most of these variables are quantified by the proportion of population within these countries that have access to respective variables.
- Aid Disbursement This data set details that amount of net aid disbursements that a country has received. This unit that quantifies the variable is US dollars.
- Air Quality by Country This data set includes information about the average air quality in a country for a certain year. The values are taken by the average air quality of the regions in the initial data set in order to obtain a value per country to compare with the other data sets. The units are in air quality index (AQI).
- Slum Population This data set includes the number of people living in areas that are considered to be slums of each country. The unit in which the variable is measured is in number of people.
- United Nations Population (https://population.un.org/wpp/Download/Standard/Population/) This data set includes the total population between the years 1950-2020 for world, regions, subregions and countries. This dataset is used to compare a country’s population to its urban population.
Since the data sets were missing some values in different years and countries, we cleaned the data (as in the second and third blog post) by removing missing values. In order to combine the data, we have joined the data sets by countries in which the data was present for and taking the most recent year for the majority of the data sets that we are working with, which is the year 2018.
In our exploratory analysis and initial modeling, we looked at the relationships between urban population growth and slum population. We saw that they were directly correlated, however, the relationship is very statistically significant, so we will look into other variables that affect slum population. We looked at the correlation between urban population and air quality; we saw that urban population is definitely a predictor of air quality, but it is not necessarily a cause of it, given that the R squared value is only 0.0259. Taking into consideration the region as well as urban population, we found that together, these are better predictors of air quality. In the future, we will be looking into the relationships between aid disbursement and slum population, as well as aid disbursement and different data included in our water_quality data set, for example, access to clean water, access to sanitation facilities, access to durable housing, and access to basic services such as electricity and telephone.
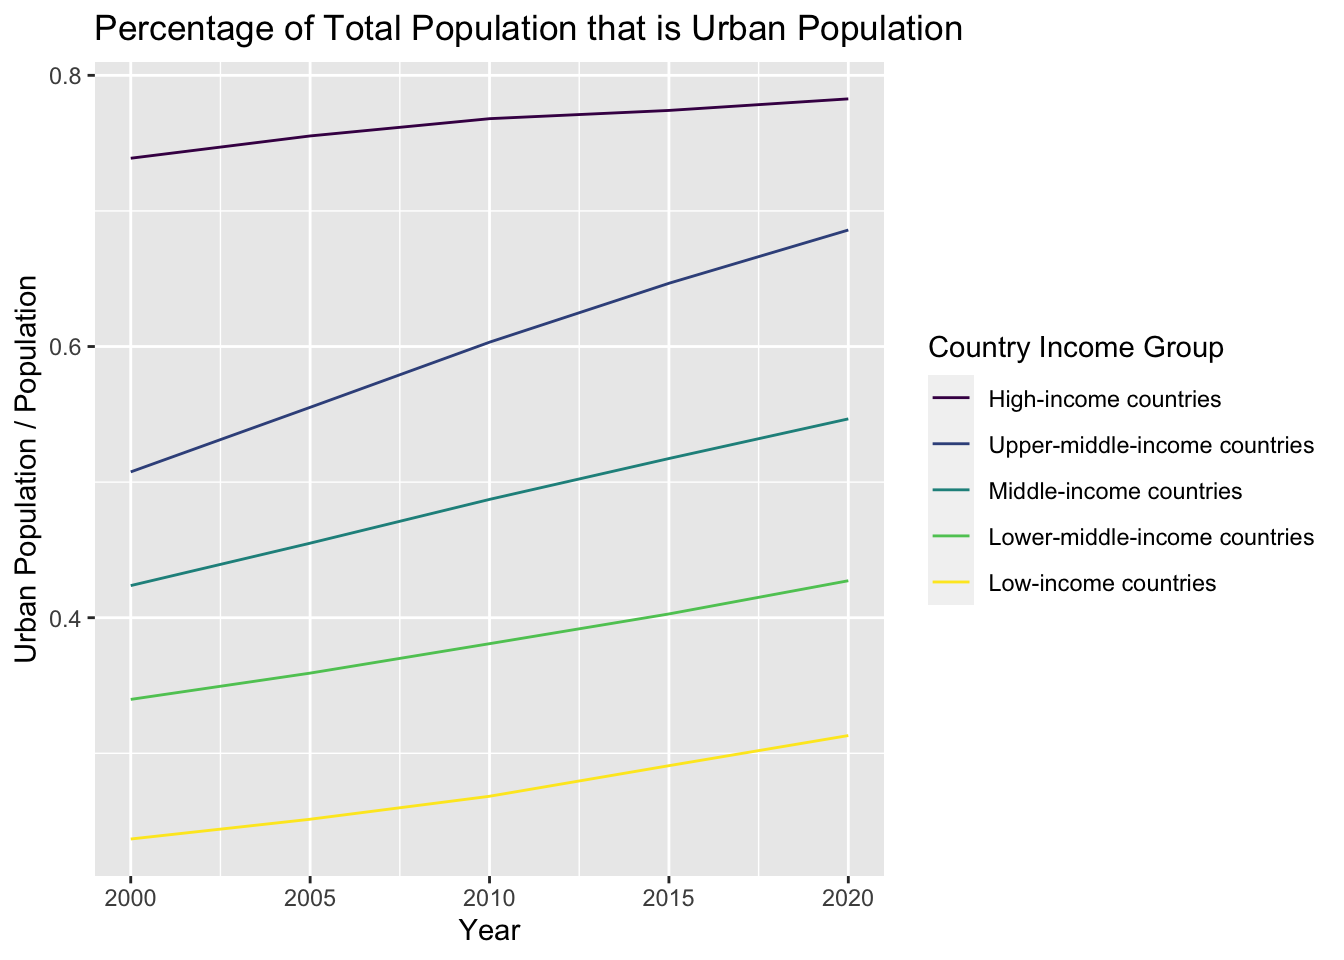
Urban Population Compared to Total Population
urb_pop <-urban_pop %>%
  pivot_longer(cols = c(`2000`:`2050`), names_to = "Year", values_to = "Urban Population")

country_pop <-total_pops %>%
  pivot_longer(cols = c(`1950`:`2020`), names_to = "Year", values_to = "Population")

pops <- inner_join(urb_pop, country_pop, by = c("Region, subregion, country or area" = "Region, subregion, country or area *", "Year"))

pops %>%
  filter(str_detect(`Region, subregion, country or area`, "income")) %>%
  ggplot() +
  geom_line(aes(x = as.numeric(Year), y = as.numeric(`Urban Population`) / as.numeric(Population), color = factor(`Region, subregion, country or area`, levels = c("High-income countries", "Upper-middle-income countries", "Middle-income countries", "Lower-middle-income countries", "Low-income countries"), ordered = TRUE))) +
  labs(title = "Percentage of Total Population that is Urban Population", x = "Year", y = "Urban Population / Population", color = "Country Income Group")